Posts

KYN Know Your Numbers

KYN: Profit Margin

“It’s not what you make, it’s what you keep!”

Prophetic words that apply to every business and simplifies the importance of profit.

Profit Margin is calculated as “Net Profit” divided by “Gross Revenue.” Essentially this calculation tells you how much of every dollar earned in gross revenue is actually profit. The smaller the profit margin, the less you keep.

It goes back over 10 years now to when I was a bank branch manager in a rural community. A client was trying to purchase a lake cottage and was upset with us that we weren’t clamoring to provide them with a mortgage. They worked very hard in their business that provided a service to the oilfield, and had expanded it several times by adding more trucks and employees. In one of their rants on me for not giving them what they wanted (it was more like “demanded” at this juncture) one of the partners (a married couple) said, “What does it take? We made a million dollars last year!” True, their top line revenue was exceeding $1,000,000 in the previous fiscal year; however, their net income – the profit – was just over $15,000. Even adding depreciation and interest back into the calculation (to arrive at EBITDA) there was no way they could service the mortgage they were requesting. Their profit margin was (in a simplified example) 0.015%, which meant that for every $1.00 in revenue they generated, they were retaining $0.015 in profits (1.5 cents profit for every dollar in revenue…hardly sustainable in a cyclical industry.)

What I Don’t Like About Profit Margin

  1. There are many variations on the calculation:
  • gross profit margin
  • operating margin
  • pretax profit margin
  • net margin…just to name a few. Each of these is measured slightly differently and has different meaning in different circumstances. If there isn’t sufficient care in assuring accurate nomenclature, things can get confusing.

2. The calculation, on face value, includes the non-cash depreciation expense (a tax figure) that often does not accurately portray the true market depreciation of an asset.

What I Do Like About Profit Margin

When calculated consistently over time, the trend will open up investigation and discussion on variances year over year (YoY) so that corrections can be made if necessary. I also like that it can be an internal benchmark, your own personal KPI (Key Performance Indicator) to which you could measure actual profit margin results against an ideal profit margin target that would fuel your business goals and growth aspirations.

Plan for Prosperity

What is a sufficient profit margin in your business? It is often relative to the industry in which you operate. If you have no idea, a good person to ask is your banker.

After spending virtually all of my professional career working on the financial and business aspects of agricultural production, I can confidently say that western Canadian grain farms need to target a 20% profit margin to sustain their businesses through the volatile cycles that affect the industry. “Target” because some years will blow right by 20%, other years will be low single digits (or negative numbers.) This truly is one space where bigger IS better!

Where has your profit margin measured out over the last 3-5 years? Which way is it trending? Why? If you don’t know the answers, or haven’t asked the questions, there is no time like right now to dig in.


KYN Know Your Numbers

KYN: Asset Turnover

In this edition of KYN: Know Your Numbers™

The Asset Turnover Ratio is one of my favorite metrics, especially when working with farm businesses. Despite what one may infer by the name, this ratio is not a promotion of turning over assets any faster than they already are. Quick turnover of assets is a major contributor to profitability challenges and cash flow challenges in the farm space.

In brief, the Asset Turnover Ratio is a measurement of how efficiently a business uses its assets to generate revenue. The calculation indicates how many dollars in revenue are generated by each dollar invested in assets. Higher is better.

The classic (textbook) version of the calculation is “Total Revenue” divided by “Average Total Assets.” So if your business generates $2.5million in revenue with $1million in average total assets, then your Asset Turnover Ration (ATR) is 2.5:1.0 (or for simplicity, just 2.5).

Here’s what I don’t like about Asset Turnover Ratio:

  • It uses “average” total assets. I have never liked using average; I feel “average” is way to make substandard performance look acceptable.
    But more to this case specifically, how do we “average” the total assets in your business? If you just take the total at the beginning and the end of the year and average those two figures, you will get an “average,” but how accurate is it? Should we be measuring assets each month and average 12 measurements? What about assets that are acquired then disposed of very quickly between measurement strike dates? I’m not a fan of average.
  • There is no clarity between which value to use when measuring assets (I.E. market value or book value)
  • The calculation does not, by definition, include leased assets (leasing has become quite popular.)
  • To be truly meaningful we must recognize that each industry has different Asset Turnover Ratios that are considered acceptable; sometimes the differences exist even within a similar space. Consider retailing: online retailers would have significantly lower investment in assets than retailers with brick & mortar store fronts. Online retailers would have significantly stronger ATR accordingly.

Once we clarify how we will approach the Asset Turnover Ratio, and maintain consistency in that approach so as to accurately trend your ATR metric over time, the ATR becomes a strong indicator of your business’ efficiency.

  1. Determine how you will value your assets:
    – when will you measure the asset values (frequency, date(s), etc.)
    – eliminate confusion and ambiguity…do two calculations, 1 with market value of assets, and 1 with book value
    – do not exclude assets under a capital lease, it will provide a false positive. Assets under a true “operating lease” can be excluded.
  2. Understand how your ATR applies to your industry. If there is a deviation in your results versus industry, is it stronger or weaker; what is causing it?

What I like about Asset Turnover Ratio:

  • it creates a stark illustration of how well a business utilizes its assets (which is a MAJOR draw on capital)
  • it is a key driver of ROA (Return on Assets – a KEY profitability ratio) and OPM (Operating Profit Margin – a KEY efficiency ratio) both of which need to be monitored closely
  • it shows the DOWNSIDE of asset accumulation (which, in the farm space, is a difficult conversation.)

Trending performed over many years by advisors with experience durations that are multiples of my own suggest that grain farms and cow/calf operations have ATR in the range of 0.33 to 0.17. Feedlots and dairies typically range from 1.0 to 0.5. User beware: these measurements are using the classical textbook definition.

Plan for Prosperity

As with any financial ratio, evaluating only one ratio does not tell the whole story. As with any financial analysis, how the numbers are quantified will have a profound effect on the results. This is not permission to ignore these important financial indicators, but more so a call to action to understand how each one affects your business so that you can make the informed decisions that will lead to profitable growth.

Not understanding the factors that affect your business is no excuse to ignore them…especially when they are within your control.

blindspot

Blind Spot

The bigger the rig, the bigger the blind spot.

For those of us who drive or have driven semi (a.k.a. highway tractor) the blind spot is a reality we must be vigilant of every time we roll. Most “4 wheelers” have never experienced the challenge of maneuvering a vehicle of that size.

Small cars have blind spots too. They are, however, much smaller and therefore easier to manage. It does not matter how big your vehicle is, your blind spot is dangerous if you don’t turn your head to have a look.

With multiple mirrors, and now even with on-board cameras, managing the blind spot has come a long way. Tools and technology have made blind-spot management far more effective.

But the blind spot is still dangerous if you don’t use the tools.

What blind spots do you need to manage in your business? Some blind spots that I’ve seen cause problems for business owners include making decisions with short term emotion versus long term vision, complacency, and entitlement, just to name a few.

All the tools and tech in the world won’t eliminate the risks coming out of your blind spot, especially if you don’t turn your head and have a look…

Short Term Emotional Decisions vs Long Term Vision

Everywhere I look, I see growing examples of business owners making short term decisions based on emotion that ignore any long term vision. In agriculture, it’s applying last year’s factors, such as drought, hail, or disease to this year’s plan. To paraphrase an astute and highly intelligent young farmer I spoke with in the last wee, “many farmers will put big hail insurance coverage on land that saw hail last year for the first time in over 10 years, or they’ll build a 2018 crop plan that is suited to a lack of moisture because of the drought in 2017…”
I see examples in cash flow management where business owners will spend frivolously after one or two good years in a row instead of building a war chest of working capital from recalling the tough times of recent memory (“recent” being a relative term that would extend to as few as 10 years ago.)

Complacency

We’ve heard all the anecdotal evidence of how we must be adaptable to change, change is the only constant, innovate or die, etc. etc.  Or the cringe-worthy, six deadliest words in business: “We’ve always done it this way.” Complacency in business is a killer. Just ask Kodak, Nokia, and Blockbuster Video.
We are in the digital age where automation, the Internet of Things, and machine to machine communication will continue to rapidly move from concepts we read about in industry publications to standard fare. Indoor plumbing and color TVs were once outlier ideas too…

Entitlement

At TEPAP, I listened in on a discussion contrasting nepotism, which usually carries with it a negative connotation, and entitlement. “Entitlement” ranks way up there on the list of my most despised words. Admittedly, I’m not a fan of “nepotism” either, but it is not inherently bad. It is when entitlement infiltrates the nepotism that things can go bad.

nepotism
ˈnepəˌtizəm
noun: patronage bestowed or favoritism shown on the basis of family relationship, as in business and politics;
http://www.dictionary.com/browse/nepotism


Plan for Prosperity

These are but three blind spots that can cause you problems in business. There are more, but each business and family are different, so none can apply to everyone every time. Ignoring your blind spot will allow a risk to sneak up on you. Yes, even if you’re in your semi-truck and a motorcycle is in your blind spot, you won’t likely be fatally injured if you collide, but your rig will be damaged and your trip disrupted. In this metaphor, the truck is your business, the motorcycle is the unforeseen risk you didn’t notice because you failed to check your blind spot. The damage to your rig may be financially insignificant, but still requires attention that is taken away from your business. The trip that was disrupted is your cash-flow, potentially your profit, and maybe, ultimately, your success.
What if you were the motorcycle and it was a semi-truck in your blind spot?
Drive safe…
Canola 100 fail title

Why the Canola 100 Challenge is So Wrong

Announced two years ago around this time, the Canola 100 challenge baits farmers into taking part in a “moonshot”: an attempt to produce a verified canola yield of 100 bushels per acre. It isn’t that efforts to increase yield aren’t a good thing, because they are. But by what means are we attempting to achieve these yields?

This “contest” may be virtuous in spirit, but it overlooks the not-so-old adage that “better is better before bigger is better.” That applies to this argument too.

The rationale behind my position is supported in this Western Producer article that describes a farmer’s chase of this moonshot, throwing everything including the kitchen sink at his crop in an attempt to cash in on the Canola 100 prize. (Spoiler alert: it failed miserably.) This particular attempt can be summarized in this quote from the article:

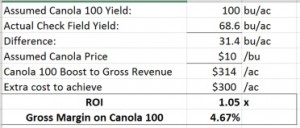
The fertility program cost $300 per acre more than what was done to the check field but yielded only 70 bu. per acre, which was 1.4 bu. per acre more than the check field.

The driving factor behind efforts to maximize yields should be ROI (Return on Investment) and Gross Margin. Doing so would focus on maximum economic yield, not maximum production yield. There’s something about that pesky law of diminishing returns that gets overlooked when trying to shoot for the moon…

If maximum economic yield is the target, then Gross Margin is the focus. How that gross margin is achieved is up to each producer, but make no mistake about where the focus needs to be. In my experience, minimum gross margin, that is gross revenue less seed, chemicals, and fertilizers, at MINIMUM needs to be 65% to sustain the business. High cost operations need greater gross margin to cover all those costs.

To put that in reverse, if 35% of your gross revenue can go to crop inputs, then each $1.00 invested into inputs should return $2.86 in gross revenue. To apply this to the example above, the “extra $300 per acre” in fertility should have delivered $858/ac in gross revenue. If Canola was $10/bu, that’s nearly 86 bushels per acre above the check field.

Canola 100 fail

Let’s push the argument harder: if the example above actually hit 100 bushels per acre, and acknowledging the control field yielded 68.6 bu/ac, the gross margin on the Canola 100 plot was $14 per acre, or about 4.67%.

This is IF the 100 bushel yield was achieved…and face it, $14 gross margin doesn’t pay many bills; in fact, it wouldn’t even buy the fuel for the contest plot.

To Plan for Prosperity

Make no mistake about the messaging here: as a producer of commodities, you need the bushels!!! But do not lose sight of the fact that as a producer of commodities, your only chance of remaining sustainably profitable is to produce at the lowest cost per unit. Period. Chasing maximum yield at a 1:1 ROI won’t get it done.

1. What is your historical gross margin?
2. What are your operating and overhead costs?
3. Know these to be able to plan for maximum economic yield.


Average

Don’t Settle For Average

It was the headline that struck me.

Don't settle for average _embedded

Settling for average in any aspect of your business will lead to certain demise. If everything was average (yields, quality, market prices, rainfall, heat units, weed pressure, disease pressure, input prices, equipment repair frequency, wages, overhead, etc, etc, etc…you get the picture) then farming would be easy.

But it’s not.

Fair to say that if you are projecting average yields and prices for 2017 you’ll be measuring those against higher-than-average costs. This is likely to total down to a negative bottom line.

I’ve never been a fan of “average.” As my old friend Moe Russell likes to say, “You can drown in a river that averages a foot deep.”

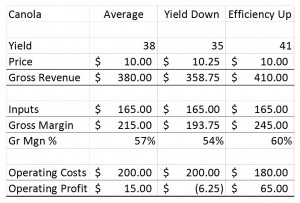
Average, to me, is nothing more than a feel good guide when looking to validate poor results. For example, acknowledging that yields were only a couple bushels below average means nothing Table for Averagewithout quantifiers like market prices (meaning we’ve calculated gross revenue), like input cost (meaning we’ve calculated gross margin), or like operating costs (meaning we’ve calculated profits from operations.) Here is a table to illustrate what I’m getting at:

If average is profitable over the long term, then we must acknowledge the need to adjust all facets of our profit calculation when one facet is below average. The problem is that generally we are seeing farms operate with higher than “average” costs and trying to pay for them with “average” yields.

To Plan for Prosperity

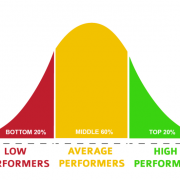
Our profitability is not determined by where it falls on a bell-curve, so why would we accept “average?”


control-word-cloud

Control

Happy New Year! My wish for your 2017, as I’ve extended to everyone regularly so far, is “peace and prosperity.” That may have been fortuitous as this, the first weekly commentary of 2017, carries a new name: Pragmatic Prosperity™.
Prosperity is not only my hope for the entire agriculture industry, it is my goal for every business I work with. Pragmatic describes the advice, strategy, and solutions we bring to each engagement. We are very excited about this evolution in our branding.


How do you employ control in your business? Is it over operations, people, cash flow? Those are quite broad descriptors, and when it comes to people, please recognize the difference between control and influence.

Here are the top areas to control in 2017 to achieve greater prosperity.

  1. Cash
    Working capital, especially cash, is a critical component of any successful business. Over the life of this weekly blog, you’ve read my constant rant about improving working capital. More and more important, the piece of working capital that needs focus, will be cash. A big part of working capital is inventory, but in a time when it is all too common for inventory to fall subject to grading issues, delivery glitches, etc, farms need the stability that comes from increased cash on hand.Expenses and debts unabashedly punish your cash. What are you doing to protect it?
  2. Marketing
    Even though we’ve had (generally) another banner year on the crop side, we have to give credit to the insulation from the commodity slide that we’ve enjoyed thanks to our slumping Canadian Dollar. Should the dollar strengthen, we’ll feel more of the pinch that our American neighbors are living with today. How would your cash flow look if you had to manage today’s expenses with 2010 prices?
    Far too many farms rely only on forward contracts. The reasons for it, I won’t speculate. Many tools and advisors exist to help you control your marketing (versus letting your marketing control you.)  When you’ve got full control over operating expenses (Point #3 below…keep reading) your marketing opportunities become more clear. This allows you to confidently price profitably.
  3. Operating Costs
    When we make more, we spend more (despite a contrarian strategy discussed here on May 17, 2016 – Spending Less is More Valuable than Earning More.) As farm incomes rose, so did farm expenses; what used to be “nice to have but could live without” has now become “must have” (in mindset anyway.) If we are to compare 2017 expenses to 2010 income (as suggested above,) why not look at 2010 expenses too? How have operating costs changed in your business over the last 7 years (2010 to 2016 inclusive)?

To Plan for Prosperity

You’ll note that the first item listed, cash, is at the top for a reason. However, if you start at the bottom, you’ll see how it is connected, how it flows and will get you to the results you desire, the results you may not think are achievable…but most certainly are.

Start with 3, it will have great impact on 2, which will lead to strength in 1. Control them all as you would control your equipment.
Make sense?
3…2…1…GO!


go fishing

If You Are Happy Just Floating Along, Go Fishing

I wasn’t trying to be funny when I quipped what is the title of this commentary while in a meeting with an excellent banker and the exciting young prospective client he introduced me to. It just sort of rolled off my tongue in the moment. It was a hit; both men enjoy fishing.

The premise of that particular conversation was profit. In my work as a lender and a consultant, I venture to say I’ve looked at hundreds and hundreds, maybe thousands, of financial statements. Those statements have told a vast array of stories, from the depths of successive and devastating financial losses to the opposite end of the spectrum with profits that make you wonder if your’re drunk when reading it. Many hang around the middle, somewhere south of an impressive profit , but still north of a fundamentally adverse loss. It is sad to discover than many farmers create this break-even situation by choice.

The choice is often centered around tax and the great lengths taken to avoid payment of income tax. The list is long and arduous; it won’t be found here.

Let’s put this in real terms. Most farms I’ve analyzed range from approximately $250/acre on the low side to $400/acre (or even higher) as the figure that represents whole farm cash costs. That is the amount of cash required to operate the entire farm for one full year. Now, I got my math learnin’ in a small town school, long before calculators were allowed in the classroom, back when cutting edge computer technology was the Commodore Vic 20, but math is math, so if we consider a 10,000ac farm with $400/ac costs, we’re looking at $4,000,000…each year!

Granted, there aren’t too many 10,000ac farmers who are happy to break-even each year, but they are out there. At the end of the day, I don’t care if you’re 400 acres or 140,000 acres, expect a profit!

Farmers take far too much risk each year to not expect a profit. If you walked $4,000,000 into any bank, could you get a better return than 0%? Of course! You could get a risk free rate in GICs that would probably approach 3% (or maybe 4%…any bankers reading this what to comment???) So I ask why, if you could get a risk free rate of 3% or 4%, why would you take a sh_t-ton of risk to accept a 3% or 4% return farming?

Direct Questions

Investing $4,000,000 in GICs and getting a risk-free 3% annual return grosses $120,000 per year before tax. Could you live on that?

Land owners/investors demand a rent that mimics 5% return on the value of the land. If you invested $4,000,000 in land, you could earn upwards of $200,000 gross in rent, plus enjoy the long term capital appreciation…could you live on that?

What is an acceptable return to demand from your business…based on the amount of risk you take each year?

From the Home Quarter

Farming is not for the faint of heart. Farmers accept the financial risks that come with farming because they understand them. The opposite if often true of stock markets: farmers aren’t typically investors in equity markets because generally they don’t fully understand the risks. But savvy stock investors who do understand the risks still expect a positive return, they aren’t happy “just getting by.”

If you’re happy just floating along, go fishing.

If you expect to get well paid for the risks you take, call me.


bin row

Crop Price Rallies (will be) Few, (and) Short

That is the headline in the recent edition of The Western Producer. Penned by Sean Pratt and primarily sharing the views of Mike Jubinville, the article contains the usual verbiage found in most articles that get classified under “commodity outlook.” Here are some of the biggest points made by Jubinville in the article:

  • The commodity super cycle is over.
  • We’re into a new era of a sluggish, more sideways rangy kind of market.
  • Canola is not overvalued and Jubinville feels that $10 is the new canola floor.
  • Wheat should bring $6-$7/bu this year.
  • $10 for new crop yellow peas is a money making price.

This last point gets me. If I had a dollar for every article that claimed a “money making price” on a commodity in such general terms, I’d be making more money! In all the thousands of farm financial statements I’ve reviewed over the years, I can say unequivocally that there are no two farms the same.

In saying that, it is abundantly clear that what is a profitable price on one farm may not be a profitable price on another. And just because $10 yellows may have been profitable last year does not for one second mean that $10 yellows will be profitable this year. Why? It depends entirely on the choices you have made in changes to your business, as well as on the differences in a little thing called YIELD.

Yield can make a once profitable price look very inadequate very fast. In fact, a 15% decrease in yield, from an expected 45 bu/ac to 38.25bu/ac, requires a 17.65% increase in price, from $10/bu to $11.76/bu to equate to the same gross revenue per acre. This factor is not linear: an 18% decline in yield requires a 21.95% bump in price to meet revenue expectations. Alternatively, an 18% bump in yield requires a price that is 15.25% lower than expected to meet the same revenue objectives.

The point is if yield is down, achieving the objective price may not be profitable. Or at the very least, it would be LESS profitable. But the bigger issue is this: How can it be stated what is or is not profitable without intimate knowledge of a farm’s costs?

If the farm’s costs and actual yield create a Unit Cost of Production of $10.20/bu, I’m sorry Mr. Jubinville, that “money-making” $10/bu price you mentioned is not profitable!

Direct Questions

How are you determining what is an appropriate and profitable selling price for your production?

What are you doing to ensure you are including ALL costs incurred to operate your farm?

If you find that your projected Unit Cost of Production is not profitable, what measures are you taking?

From the Home Quarter

Far too often, we can get caught up in making critical business decisions based on what we “think” is appropriate, on a hunch, or on pure emotion. Using Unit Cost of Production calculations to validate your farm’s profitability is an incredibly empowering exercise. I’ve been in a meeting with a client and witnessed the entire crop plan change during the meeting based on Unit Cost of Production information.

What is not measured cannot be managed, and measuring your profit is pretty darn important.


information

Managed Risk – Part 4: Liquidity

We’ve all heard the saying “Cash is King.” In my opinion, “cash isn’t king, it’s the
ACE!” Whatever metaphor you prefer, the point is that cash levels and cash flow are both critically
important to your business. So, let’s get right to four points that affect your liquidity:

1. Your view of cash.
When I was still farming, I asked dad when he wanted to receive his rent payment, now (at the
time it was late November) or after January 1. He replied, “Well, I wouldn’t mind seeing a bump
in my bank account now, but I’ll wait until January for income tax purposes. Why?” When I
admitted that at that time we had no cash and would be dipping into our operating line of
credit, he said, “I thought you said your farm was profitable.” Our farm was profitable. He
couldn’t wrap his head around the fact that a profitable farm might not have cash always at the
ready, especially a small farm still in its youth. He equated profit with cash in the bank. After
arguing the point for 5 minutes, he just shook his head saying, “I guess that why I’m not farming
any more, I just can’t take that much risk.”

What he was getting at with his final comment was how we very quickly allocated our cash that
year. With harvest sales, we cleared up all accounts payable, pre-bought some fertilizer, and
paid down our supplier credit. The bins were still full, and with more grain sales scheduled for
the weeks and months ahead, our working capital was strong.

What is the difference between cash on hand and working capital? (HINT: if your answer is
“nothing,” then think again, a little deeper this time.)

2. Your use of cash.
Over the last few years, how many new pickup trucks were paid for out of working cash or put
on the operating line of credit? This is one example of a poor use of cash. A business that is flush
with cash can be a dangerous thing in the wrong hands, but don’t fret because the laundry list of
vendors all clamoring for your money will offer plenty of opportunity for you to part with it.
Do you justify some of these types of expenditures as part of a “tax plan?”

3. Your timing of cash.
One of the major challenges for manufacturing companies is the “cash conversion cycle.” This is
the time it takes to convert raw materials into cash. This cycle happens frequently in a
manufacturing firms operating period, often several times each month or quarter (depending on
what they are manufacturing.) Your challenge in the business of farming is that you only get one
cash conversion cycle per year. You invest in inputs early, manage through a long production
cycle, only getting one chance at producing the crop that will be sold for cash, and eventually
selling it sometimes as late as half way through your next production cycle. It is this long cash
conversion cycle that makes cash management vitally important on your farm.

How long is your farm’s cash conversion cycle? (HINT: it is measured in days.)

4. Managing your liquidity.
Working capital is a component of your liquidity. Measured as the difference between current
assets and current liabilities, your level of working capital is a direct indication of your business’
ability to fund its current operations. This, or course, is critically important to your lenders.
The desire to utilize easy credit and therefore finance everything from combine belts to
hydraulic oil may sound like a simple way to keep the wheels turning. If your farm is without
cash due to poor crops/pricing/etc. from the previous year, then available credit is a lifesaver to
help you keep operating. Just remember, such a scenario is a short term solution, and by no
means can it be considered a long term strategy. Sooner or later, your creditors will tire of
holding all the risk of funding your operations. Your working capital must be built and
maintained.

How much working capital is appropriate for your farm? (HINT: it’s probably more than you
think.)

Direct Questions

How do you view cash? Does it only have value when allocated (spent,) or is it an essential asset on the
balance sheet?

If you believe cash in the bank is an indication of profitability, can you not save your way to increased
profit?

How would you describe the financing cost to your business relative to the long cash conversion cycle
and the cost of credit?

From the Home Quarter

I had heard a seasoned old banker years ago say how “farmers don’t like to have money in the bank,
because as soon as it gets there, they spend it!” When there is cash in the bank, we feel profitable, and
often the decision is to allocate that cash to another asset. Will that other asset help repay liabilities?
For as long as I can recall, this industry has always dubbed itself “asset rich & cash poor;” the push
among players has been to build equity. And while the chase for equity is noble, equity does not pay the
bills, nor does it make loan payments, nor does it meet payroll. Cash does.

We must make cash management an utmost priority. If we are relying on financing for most/all of our
daily operations (operating credit,) what will happen if/when a lender does not renew those lines of
credit? Do you recall the ruckus out of the US each time they need to “raise the debt ceiling?”
Potentially, all government operations would get shut down. Same goes for your farm. If you have no
cash, and your credit lines get called, what are your options? I can tell you, they aren’t pretty.

It does not matter whether you believe “Cash is King,” or “Cash is the Ace.” If you have neither, you
might be forced to fold.

farm

Managed Risk Part 1: Harvest Sales

In an email last week, a farmer friend and former colleague of mine admitted to having 100% of his 2015 crop sold before harvest. It is the first time this has ever happened on his farm. From my years working in ag finance and farm management consulting, I can confidently say that virtually all farms are not 100% sold on new crop in advance of harvest.

As with anything, there are benefits and drawbacks to being 100% sold early in the crop season. It’s easy to identify the drawbacks: production risk (broken into yield risk and quality risk), opportunity risk (if the market appreciates after you’re sold), etc. etc. We’re not going to dwell on these because it’s safe to say almost every farmer has already spent more than enough time hashing and rehashing all the reasons why they shouldn’t sell too early. There are far more drawbacks that have been touted over the years (real, perceived, or otherwise) than I care to scribe. You’ll notice I didn’t put weather risk on the list; it is because we cannot influence or control weather. Why stress over that which you cannot control?

How about some of the benefits:

  • Reduced delivery risk
  • Eliminated market risk
  • Reduced storage risk
  • Controlled cash flow risk

When admitting his crop was 100% sold already, my friend and I didn’t get into the details of what was in place so that he felt comfortable making such a decision. He did acknowledge that prior to harvest the prices were too good to pass up. While price is an important factor, price alone is not sufficient to pull this trigger. Here’s more on what you need if you want to be a more aggressive price maker, instead of a passive price taker.

  1. Excellent relationship with your buyers.
    When it comes to dealing with quality and grading, delivery times, or anything in between, a solid relationship with the buyer of your grain is crucial. Try using a sense of entitlement when next dealing with your buyers and see how far you get. This one is obvious; we won’t dedicate any more space describing what you already know.
  2. Know your costs, especially Unit Cost of Production. As one of my favorite young farmers likes to say, “You can’t go broke by selling for a profit.” Such true words require that you know what it cost to produce a bushel or a tonne so that the price you accept is actually profitable. This isn’t an easy task before harvest, but those farms that have elevated management functions can clearly illustrate UnitCOP with allowances for deviation in expected yield or quality. Refer back to point #1 when dealing with those deviations.
  3. Abundant Working Capital.
    Any drawback, real or perceived, to selling most of your crop ahead of harvest is mitigated by having abundant working capital.
    The biggest selling benefit from having abundant working capital is being able to sell when you WANT to instead of when you HAVE to. The ability to sell on your own timeline affords you the opportunity to deliver in your preferred month, and to seek out your preferred price. Abundant working capital also alleviates the fear of costs incurred from not meeting contract requirements when aggressively forward selling. The hesitation felt from the potential of having to “buy out” a contract if specs aren’t met can be eliminated if working capital is abundant.

It is not unreasonable to see more reluctance this year among durum growers to forward price as aggressively as in the past. The fusarium fiasco of 2014 hurt numerous farms financially and created an air of hesitation. But if working capital was a non-issue on every farm, durum growers would not be shy to forward price after the 2014 experience. While none want to set themselves up for unnecessary cost incurrence, the ability to handle the potential cost alleviates the concern of incurring it.

Direct Questions

How would you rate your relationship with your grain buyers? What can be done to improve it?
How would you describe your knowledge of your Unit Cost of Production, and net profit margin?
What is your current level of working capital and what does it need to be to provide you with full confidence to aggressively forward price?

From the Home Quarter

Please let it be clear that this message is not encouraging everyone to sell 100% of new crop production ahead of harvest. Such a strategy takes on risks that not every farm can mitigate. But if you are desirous in forward pricing more new crop than you have in past years, then let this message offer you some tips on what you need to have in place to make that happen.
You may have noticed that working capital is a central theme to many messages delivered here weekly. If you are able to focus on only one priority, let it be working capital.
Our proprietary Farm Profit Improvement Program™ begins with working capital evaluations and True Cost of Production analysis. Please call or email to learn how this process can bring value to your farm.