Farm Acronym Challenge: ROI and ROA
ROI (return on investment) is a metric I lean on heavily when working with clients to illustrate an expectation of profit. Each farm deploys (what feels like) unprecedented volumes of capital every year in an effort to grow a crop; there should be an expectation of profit for doing so, and I expect my clients to demand an ROI that reflects the risk they take. Accepting lesser returns is insufficient and could be realized with less risk by deploying said capital elsewhere.
We can break down ROI by measuring a return on various aspects: crop inputs, investment in equipment, annual cash costs, etc. Some of the many options against which we can measure ROI are highly useful, others less so. We try to decide which metrics to measure based on which gives us the most useful information. Of course, the ability to have an accurate measurement of ROI depends entirely on quality information and your ability to collect it.
ROA (return on assets) is a measurement I will be using more in the future than I have in the past. More and more I am finding that there are excess assets on farms, especially equipment, that are using good capital yet providing an inadequate return. Here is what I mean.
ROA is defined as a company’s net earnings relative to total assets. By dividing net earnings by total assets, we see how efficient management is at using assets to generate profit. A company that generates $1,000,000 in net earnings on $5,000,000 in assets has a 20% ROA. A similar company generating $1,000,000 profits with $10,000,000 in assets has a 10% ROA. It’s simple math. And the question begs: if you had invested $10,000,000 elsewhere, could you get better than a 10% return on those assets?
Before the argument about land values is thrown out there, let’s just curb it right away. Yes, ROA can be manipulated (as can ROE – return on equity) by owning fewer assets. Banks do it all the time: they sell their owned real estate such as stand alone bank branches and ivory office towers in order to lower their total assets, thereby making their profitability (when measured as ROA) look fantastic.
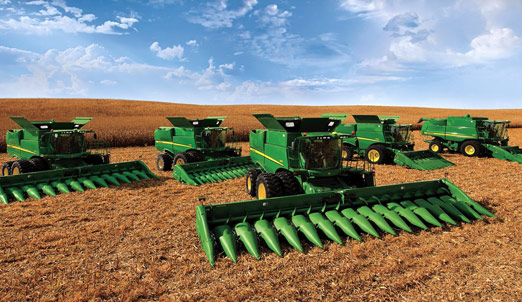
Today, let’s focus on the asset that gets much love: farm equipment.
How would we measure ROA when it comes to farm equipment? I prefer to use Fair Market Value (FMV) because that figure represents both what it would cost you to acquire said asset and what you could reap should you sell said asset; it is arguably the asset’s intrinsic value. Online searches and blue book values are great ways to validate FMV. I summarize it as “when the auctioneer’s gavel drops, what would you get for that piece of equipment?”
Focusing on ROA as it pertains to equipment only, and excluding land, levels the playing field so to speak. All things being equal, this approach will clarify which farm management team is efficient with how it invests in equipment, and which is not.
Direct Questions
How do you measure the effectiveness of your investment in assets, specifically equipment?
Are you over-invested or under-invested in equipment? What evaluation methods do you use to validate your position?
If you were to invest your capital elsewhere, what return would you expect? What return do you expect from your farm? Is there a difference? Why?
From the Home Quarter
When calculating ROA, consider multiple criteria: all assets (land, buildings, equipment;) land and equipment only; equipment only. The ROA will obviously be much lower when including more assets, but don’t let that sway you into selling land to improve your ROA. Land ownership has been, and will continue to be, the anchor of a farm’s wealth.
What is a target ROA? The jury is still out. Simply put, there isn’t a large enough sample with adequate accurate information available to draw from.
So let’s find out!
With the utmost confidence and maintaining your privacy always, I am proposing an experiment: Email to me your net earnings, your cultivated acres, and your fair market value for each of land, buildings, and equipment for 2015. I will compile the data with no identifying criteria so that you maintain privacy. The compiled data will be available only to those who take part in the experiment. Include 2014 and 2013 as well if you’d like to see how you are trending.
As a thank you for taking part, Growing Farm Profits will offer an analysis with feedback on your ROA and ROI calculations and trends at NO CHARGE! (Normally a $470 value!) – Offer expires April 20


Leave a Reply
Want to join the discussion?Feel free to contribute!